IELTS Writing Task 1 Bar Chart Sample Answer (3 Band 8+ Examples)
Bar charts are one of the most common question types in IELTS Academic Writing Task 1. To achieve a high band score, you should identify the main trends, compare figures, and provide a clear overview instead of describing every number individually.
Below are three IELTS bar chart questions with Band 8+ model answers.
Sample 1: Number of Tourists Visiting Different Countries in 2023
Question
The bar chart shows the number of tourists (in millions) visiting six different countries in 2023. Summarize the information by selecting and reporting the main features, and make comparisons where relevant.
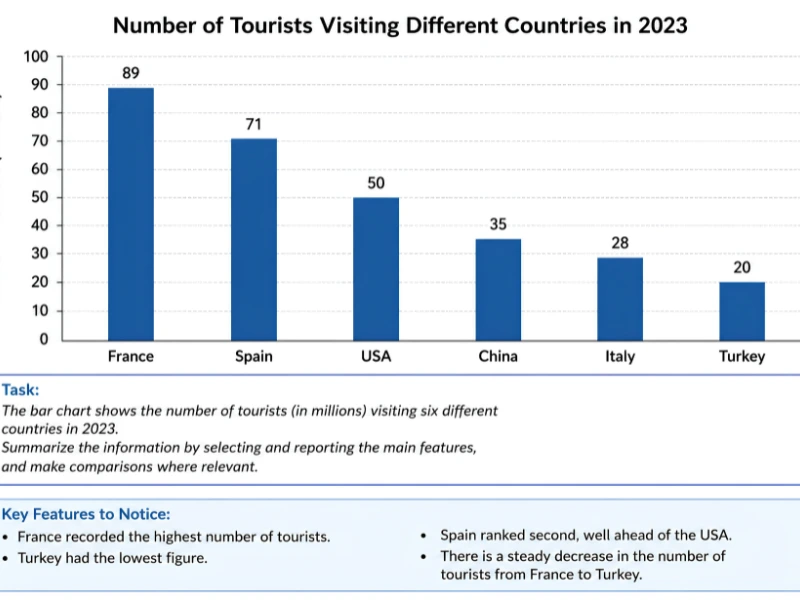
The bar chart compares the number of international tourists who visited six countries in 2023, measured in millions.
Overall, France attracted the highest number of tourists, whereas Turkey received the fewest visitors. In general, there was a steady decline in tourist arrivals from France to Turkey.
France welcomed 89 million tourists, making it the most popular destination among the six countries. Spain ranked second with 71 million visitors, while the United States attracted exactly 50 million tourists.
The remaining countries recorded considerably lower figures. China received 35 million tourists, followed by Italy with 28 million. Turkey was the least visited country, attracting only 20 million tourists. Notably, France received more than four times as many tourists as Turkey and almost 20 million more than Spain.
Sample 2: Average Monthly Rainfall in Five Cities
Question
The bar chart shows the average monthly rainfall, measured in millimetres, in five different cities. Summarize the information by selecting and reporting the main features and make comparisons where relevant.
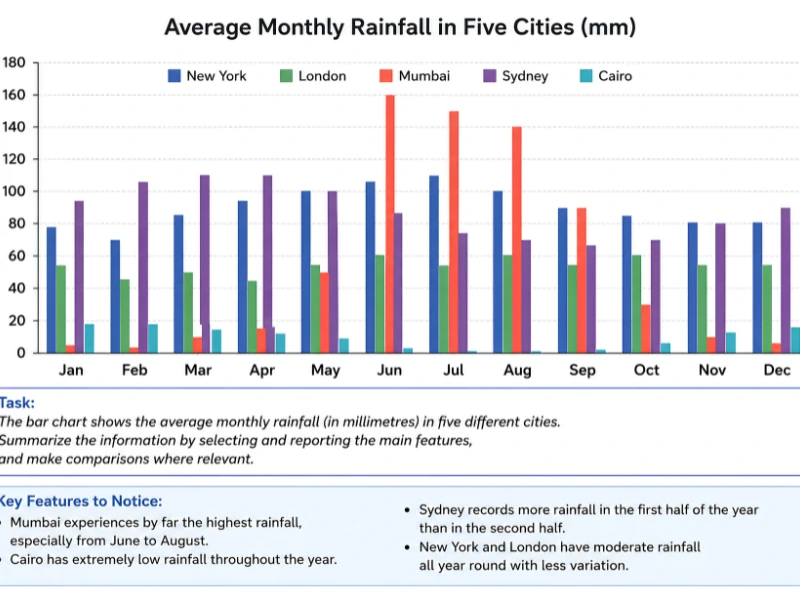
The bar chart illustrates the average monthly rainfall in five cities over a one-year period.
Overall, Mumbai experienced by far the highest rainfall levels, particularly during the middle of the year, whereas Cairo remained extremely dry throughout the year. New York and London recorded relatively stable rainfall figures compared with the other cities.
Mumbai's rainfall increased dramatically from May onwards, reaching approximately 160 mm in June before remaining exceptionally high in July and August. In contrast, Cairo consistently recorded very low rainfall, generally below 20 mm throughout the year.
New York experienced moderate rainfall, fluctuating between about 70 and 110 mm. London showed a similar pattern, although its figures were generally lower than those of New York. Sydney recorded substantial rainfall during the first half of the year before gradually declining in the later months.
Overall, the greatest variation was observed in Mumbai, while Cairo showed the most stable pattern.
Sample 3: Energy Consumption by Source in Four Countries in 2022
Question
The bar chart shows energy consumption from five different sources in four countries in 2022, measured in thousand terawatt-hours. Summarize the information by selecting and reporting the main features and make comparisons where relevant.
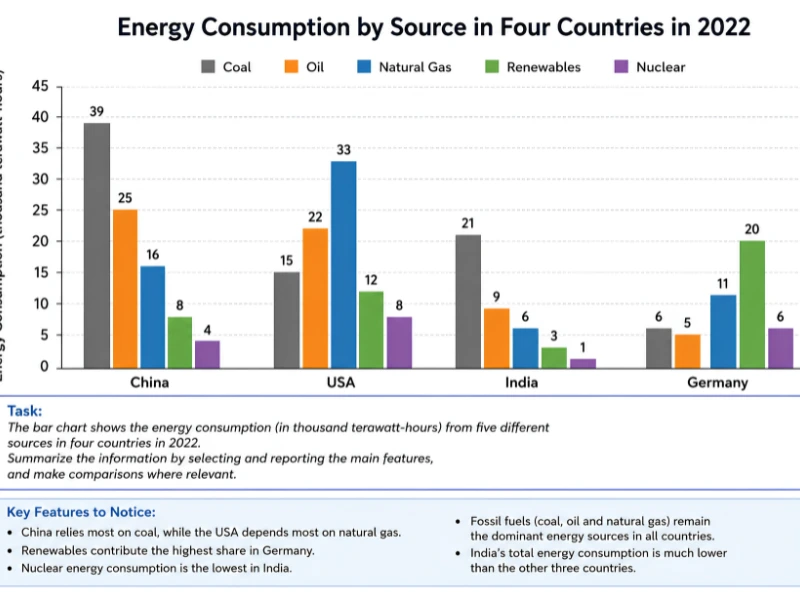
The bar chart compares energy consumption from five sources across four countries in 2022.
Overall, fossil fuels remained the dominant source of energy in all countries. China consumed the largest amount of coal, while the United States relied most heavily on natural gas. Germany recorded the highest consumption of renewable energy.
China consumed 39 thousand terawatt-hours of coal, considerably more than any other country. It also used substantial quantities of oil and natural gas, at 25 and 16 thousand terawatt-hours respectively. By contrast, the United States relied primarily on natural gas, which accounted for 33 thousand terawatt-hours.
India's energy consumption was generally lower across all categories. Coal remained its primary source at 21 thousand terawatt-hours, while nuclear energy contributed only 1 thousand terawatt-hour.
Germany displayed a different pattern. Renewable energy was its largest source at 20 thousand terawatt-hours, significantly exceeding the corresponding figures in the other countries. Nevertheless, fossil fuels continued to account for a considerable share of Germany's overall energy use.
Useful Vocabulary for IELTS Bar Charts
Describing Increases
- + increase
- + rise
- + grow
- + climb
- + surge
Describing Decreases
- + decline
- + fall
- + drop
- + decrease
- + plunge
Comparing Data
- + higher than
- + lower than
- + exceeded
- + was greater than
- + accounted for
Describing Stability
- + remained stable
- + stayed constant
- + showed little change
- + maintained a similar level
Common Mistakes in IELTS Bar Charts
- 1Describing every number individually.
- 2Forgetting to write an overview.
- 3Using personal opinions.
- 4Ignoring major trends.
- 5Copying wording directly from the question.